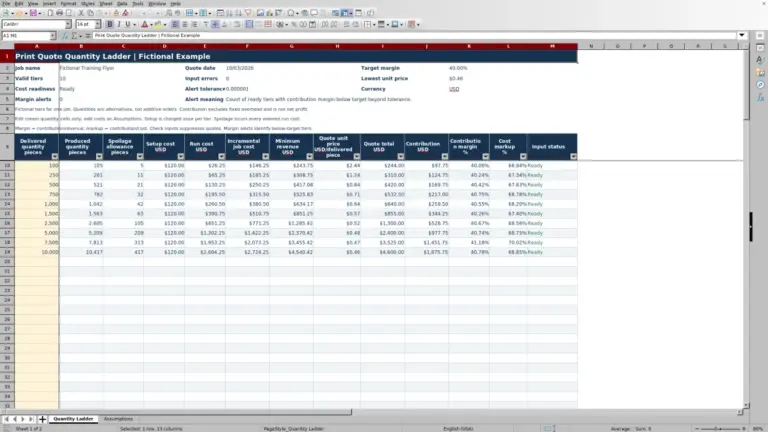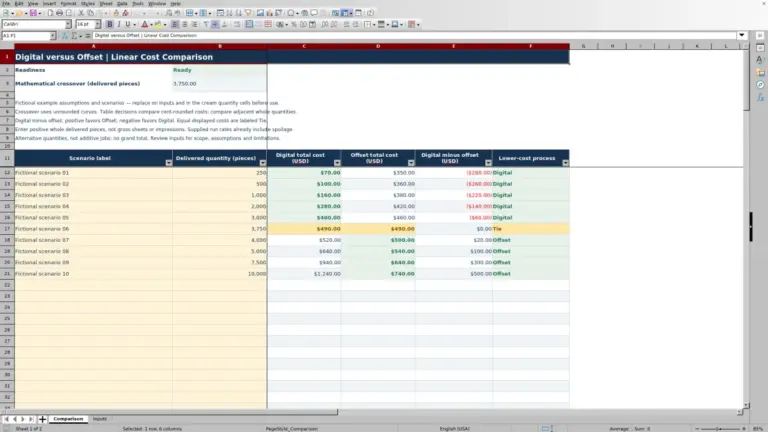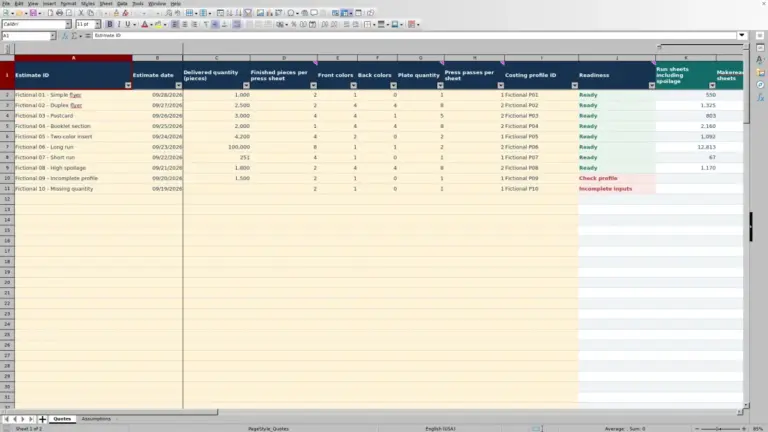
A meter rate alone does not tell you what a digital print run will cost. The Print Shop Sheets digital print click cost calculator combines your entered click rates, paper, waste and labor to compare production cost per delivered printed sheet.
This editable Excel workbook supports manual estimating for independent commercial print shops. Use it to compare supported cost scenarios before building a quote—not to calculate a selling price or manage production. All populated examples and starting rates are fictional.
Where this workbook helps
- Compare mono, color and mixed-duplex scenarios on a consistent delivered-sheet basis.
- Account for setup waste and run spoilage when estimating paper and impressions.
- Separate setup and run costs to see how each contributes to the production estimate.
- Identify incomplete inputs before treating a blank result as a usable cost.
What is in the file
How to get started
1. Enter your shop’s rates
In Meter Rates, enter a unique Profile ID, description and both rates in USD per impression. In Paper Rates, enter a unique Paper ID, stock description, dimensions, weight convention, weight value and Rate (USD/sheet). Replace the fictional starting labor rates in Assumptions with your own estimates in USD per minute.
2. Build a scenario
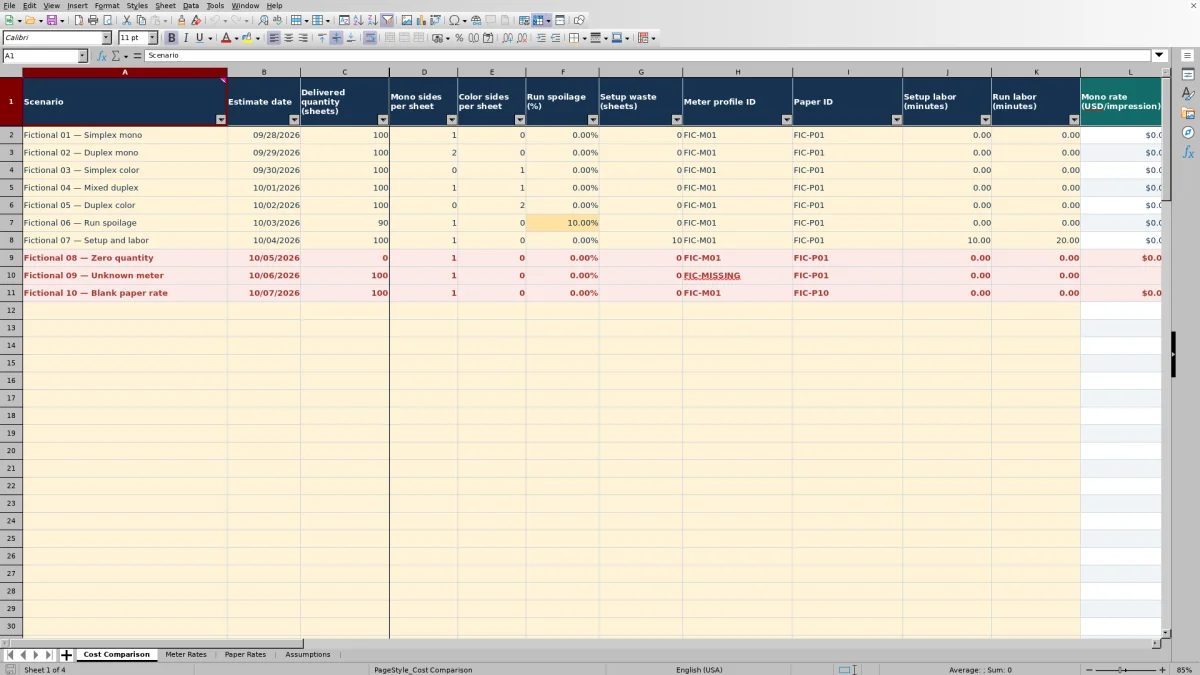
In Cost Comparison, complete an input row with a Scenario name, Estimate date and Delivered quantity (sheets). Enter the mono and color sides per sheet, Run spoilage (%), Setup waste (sheets), and setup and run labor minutes. Select the Meter profile ID and Paper ID for that scenario. Enter numeric zero where no waste or labor is planned rather than leaving required numeric fields blank.
3. Check and recalculate
Open and recalculate the file in Excel or LibreOffice before reading results. Resolve any Check inputs status in the scenario or its referenced rate records. Ready is an input-check result, not confirmation that your rates, waste allowance or production plan are correct.
4. Compare costs and preserve the estimate
Filter Input status to Ready before sorting total or unit cost. Check the consumed sheets and impression counts as well as the dollar results. Save a dated copy before changing shared rates, then carry the selected production estimate into your separate quoting process.
Keep delivered sheets separate from impressions
Start by defining what you need to deliver. In this workbook, one unit is one delivered printed sheet. It is not a cut business card, a booklet or another finished piece. One printed side counts as one impression.
Use Mono sides per sheet and Color sides per sheet to describe the printing on each sheet. Simplex uses one side; duplex uses two. Mixed duplex means one mono side and one color side. Each side count must be a whole number from zero through two, and the combined count must be one or two.
The workbook multiplies total consumed sheets by each side count to obtain mono and color impressions. Before applying those counts to an estimate, verify how your meter agreement classifies color and charges for the selected paper size. The model assumes one impression per printed side; it does not interpret your agreement or apply separate size-based billing rules.
Allow for run spoilage without hiding setup waste
Run spoilage (%) represents the fraction of run sheets expected to be lost, not a simple percentage added to the delivered quantity. To allow enough sheets for the intended delivery, the workbook divides delivered sheets by one minus the spoilage fraction and rounds up to a whole sheet: required run sheets = ROUNDUP(delivered sheets / (1 − spoilage fraction), 0).
Setup waste (sheets) is then added separately to produce Total consumed sheets. Run spoilage (sheets) is the difference between required run sheets and delivered sheets; it does not include setup waste. This separation lets you revise a setup allowance without changing the assumed run loss rate.
Every consumed sheet is assumed printed with the selected side mix. That includes setup waste and spoiled run sheets. If your actual setup consumes blank stock or a different mix of printed sides, the modeled meter cost will not match that detail. Review the assumption before using the result, and document any separate adjustment outside the workbook. Spoilage and waste entries are your estimates, not standard allowances.
Fictional example: compare simplex and duplex mono
The supplied Fictional 02 — Duplex mono scenario illustrates the difference between sheets and clicks. It uses 100 delivered sheets, two mono sides per sheet, zero color sides, no run spoilage, no setup waste and zero setup and run labor minutes.
Its FIC-M01 meter profile supplies a fictional mono rate of USD 0.01 per impression. FIC-P01 supplies a fictional paper rate of USD 0.04 per sheet for 8.5 × 11-inch, 60 Text (lb) stock. These are demonstration inputs, not current supplier or service rates.
- Required run sheets and total consumed sheets are both 100.
- 100 sheets × 2 mono sides = 200 mono impressions.
- 200 impressions × USD 0.01 = USD 2.00 in meter cost.
- 100 sheets × USD 0.04 = USD 4.00 in paper cost.
- With no labor cost entered, total production cost is USD 6.00, or USD 0.0600 per delivered sheet.
The supplied simplex-mono scenario uses the same quantity, rates and zero allowances but prints one side. Its total is USD 5.00, or USD 0.0500 per delivered sheet. The duplex scenario therefore adds USD 1.00 in this fictional comparison because it doubles impressions, not paper consumption.
The next decision is whether the required job needs one-sided or two-sided printing, then whether the zero waste and labor assumptions are realistic. Replace those demonstration allowances before using either scenario as the basis for a quote.
Read the cost breakdown without double-counting
Setup cost (USD) includes setup labor minutes multiplied by the setup labor rate, plus paper and impressions consumed by setup waste. Run cost (USD) includes run labor minutes multiplied by the run labor rate, plus paper and impressions for all required run sheets.
Total production cost (USD) is setup cost plus run cost. You can also reconcile it as meter cost plus paper cost plus both labor amounts. Do not add meter and paper costs to the total again. They are already included in the setup and run figures.
Unit production cost (USD/delivered sheet) divides the total by delivered sheets, not by consumed sheets or impressions. This places the modeled cost of waste on the sheets you intend to deliver.
The result is a production-cost estimate within the workbook’s scope. It excludes finishing, markup, margin, tax and unlisted overhead. Before setting a selling price, account for omitted work and your pricing policy separately. The workbook does not calculate either markup or margin.
Troubleshooting blank results and Check inputs
A blank cost is not a zero-cost job. Empty input rows remain visually blank, and scenarios that are not Ready do not display calculated costs. Start with Input status in Cost Comparison, then check Rate status for the referenced meter and paper records.
- Missing meter rate: enter both mono and color rates, even if the scenario uses only one. An explicit numeric zero is permitted; a blank is not treated as zero.
- Duplicate or missing ID: give each catalog record a unique ID and select the matching ID in the scenario. Do not use duplicate IDs to represent successive rate versions.
- Incomplete stock record: supply positive dimensions and weight, an accepted Weight convention, and a nonnegative paper rate. A description and unique Paper ID are also required.
- Invalid quantity or side mix: use a positive whole number for delivered sheets, a nonnegative whole number for setup waste, and a combined mono/color side count of one or two.
- Invalid spoilage entry: enter a percentage at least zero and below 100%. Include the percent sign when typing a percentage to avoid entering a whole-number fraction by mistake.
- Missing date or labor entry: use a valid Excel date and nonnegative numeric labor minutes. Use zero only when you intend to exclude that labor amount.
The fictional tenth paper profile deliberately has a blank rate to demonstrate blocking. Also note that formula cells are not protected against editing: Cost Comparison columns L–Z and the catalog status columns contain formulas. If a result stops calculating after an edit, check whether a formula was overwritten and restore it from an unchanged copy rather than typing a cost into the output.
Compare current rates while preserving earlier estimates
For a useful cost comparison, hold the job requirements constant and change only the assumptions you intend to evaluate. Separate scenario rows can use different meter profiles or paper records. If you also change labor or waste, make that distinction clear in the Scenario name so a lower total is not mistaken for a rate-only difference.
Paper dimensions and weight identify the stock; they do not calculate sheet yield or imposition. Enter the supplier cost on the same per-sheet basis used by the scenario. A carton or ream price must be converted to USD per sheet before entry. Keep Text (lb), Cover (lb), Bond (lb) and Grammage (g/m²) distinct—their numeric weights are not interchangeable.
Rate lookups use the current catalog entries, and labor calculations use the shared rates in Assumptions. Editing those values can change existing scenario results. The Estimate date labels the scenario but does not freeze its rates. Save a dated workbook copy before revising shared assumptions if you need to retain the basis of an earlier quote.
Compare this workbook with a blank spreadsheet
A blank spreadsheet is a realistic alternative when your estimator already maintains a shop-specific cost model. The choice depends on whether this workbook’s delivered-sheet model matches the job or whether you need to design a different calculation.
| Method | Cost calculation | Input checks | Scope and upkeep |
|---|---|---|---|
| Print Shop Sheets workbook | Prepared calculations for paper, mono/color impressions, waste and labor per delivered sheet. | Prepared validation and status checks for supported inputs and catalog records. | Manual rate maintenance within a defined model; no finishing or selling-price calculation. |
| Blank spreadsheet | You design the units, formulas and breakdown for the jobs you estimate. | You add and test any validation or error checks you need. | You define and maintain the scope, including any additional cost or pricing logic. |
Use this workbook when its sheet-and-impression model fits the comparison and you want prepared calculations. Use a custom spreadsheet when the estimate requires a different unit basis or additional operations, provided you can build and test that logic. Neither approach turns manually entered assumptions into verified production costs. This resource is an editable workbook, not print management information system (MIS) software or a consulting service.
Frequently asked questions
Does this calculate home inkjet cartridge yield?
No. It uses manually entered USD-per-impression meter rates for mono and color printing. It does not calculate cartridge yield, ink coverage or ink consumption from artwork.
Can I use the unit cost as a price per finished booklet or cut piece?
No. The output unit is a delivered printed sheet. The workbook does not calculate cutting, trim, bleed, finishing or production-ready imposition. Establish the relationship between printed sheets and finished pieces separately, then account for the additional work before quoting the finished product.
How many scenarios can I enter?
Cost Comparison has 100 prepared scenario rows, from row 2 through row 101. Meter Rates and Paper Rates each have the same prepared row range. Do not assume entries beyond those ranges inherit the formulas, validation or lookup coverage.
Can I open the workbook in LibreOffice?
The workbook’s use notes direct you to open and recalculate it in Excel or LibreOffice before reading calculated results. Recheck statuses and results after editing rather than relying on a file preview or an unrecalculated display.
Does it estimate labor time from the number of sheets?
No. You enter Setup labor (minutes) and Run labor (minutes) for each scenario. The workbook multiplies those minutes by the respective USD-per-minute rates in Assumptions. It does not derive run time from press speed or schedule the job.
Editorial coverage

Clara WinslowPrint estimating editor

Miles FenwickPrint workflow editor